
Tackling Change
A Toolkit for Quality Process Improvement
Step 4:
Define your measures
Key Point
You can’t improve if you can’t measure the results easily and reliably!
-
You need to clearly identify what your process goals are, what your ultimate outcome goals are, and how you will measure these goals in a way that is sustainable. Consider:
-
How often will you measure?
-
At what point do we deem the project a success or failure?
-
Is gathering your measure sustainable?
-
-
Could this program have an effect on the bottom line of the hospital/system? Will this program affect staffing?
If the program will impact multiple hospitals financially, contact Hospital Financial Planning and Analysis for help in quantifying the economic impact of your change.
If the program will impact an individual hospital financially, please reach out to your local finance representative for assistance in quantifying and measuring financial improvement.
-
If you are tackling a patient satisfaction project, all patient satisfaction data should be coming from our standard reporting system, Cognos. If you have questions, email PatientSatHelp@upmc.edu.
-
Make sure that you are measuring both how reliably you are able to implement your change (process measures) and if your interventions have the impact you expect (outcome measures).
-
The closer to real-time data you can get, especially for process measures, the easier it will be to learn and improve.
-
-
Consider balancing measures — What might you negatively impact with your change?
For example: If length of stay goes down too much, readmissions will go up.
-
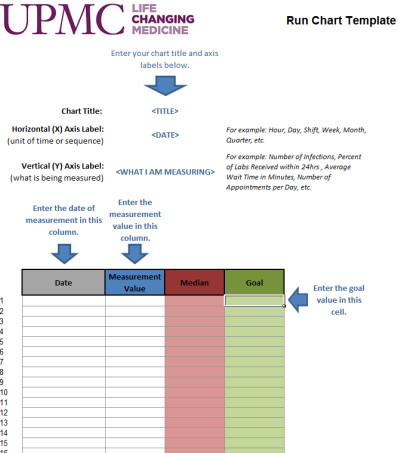
A critical strategy to understand if your changes are making a difference is to track your changes over time using a run chart. Use our easy-to-use run chart template to track and understand your data. It can be used for rates or raw numbers and can be used for process, outcome, or balancing measures.
-
See some examples of completed run charts here.
-
Refer to our power point to review the rules for interpreting run charts.
-
Need to be walked through how to use the run chart? Check out our power point.
-
Remember you must collect baseline data before you manage your change!
-
Do you need help with this step? Drop us an email at QualityQuestions@upmc.edu and Wolff Center staff will be happy to help you.